
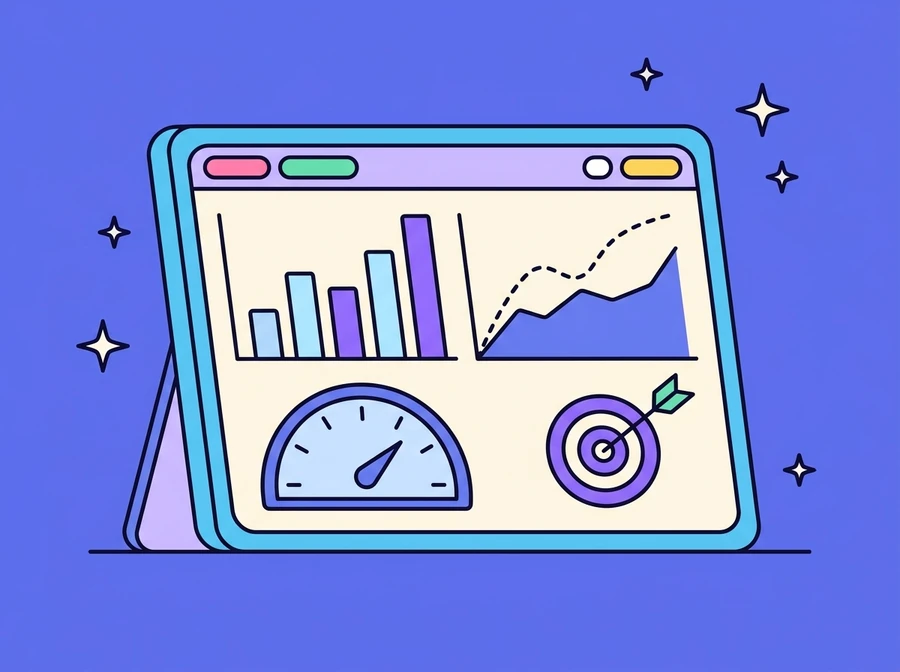
A dashboard that analyses and forecasts daily and monthly sales, built with AI/ML, placing the forecast alongside actual sales on the same page. Executives and sales teams can therefore see the gap between plan and result while the month is still running, and can filter down to the level of product, category, region, channel and individual customer.
Who it is for
Executives and sales teams who need to know by mid-month whether sales will reach target, rather than finding out once the books are closed.
Daily forecasts, set beside actual sales
The system shows the daily sales forecast the AI has calculated directly against that day's actual sales, so any deviation appears immediately instead of hiding inside the month-end total. The aim is to reduce estimates made on gut feel, and to give the production and delivery teams figures in advance for planning capacity and delivery rounds. Alongside it is a cumulative month-to-date view against the forecast, which shows whether the month as a whole is running ahead of or behind plan.
- AI daily forecasts compared with actual sales
- Fewer deviations from human estimates
- Used to plan production and delivery in advance
- Track month-to-date sales against the forecast
Filter on every dimension, view any period
The same dataset can be read from several angles: filter by Product, Category, Region, Channel and Customer, then switch between daily, monthly or historical views on the same page. Every view compares three ways at once (against target, against last year and against the forecast), so a question such as "which channel missed target, and from when?" can be answered on screen without commissioning a new report.
- Filter by product, category, region, channel and customer
- Switch between daily, monthly or historical views
- Compare sales against target, last year and the forecast
Track performance with metrics you can actually decide on
The Smart Performance Monitoring section summarises %YoY, %Target and Gap for sales across every dimension, and drills down to region, customer or product level to pinpoint where the gap between plan and result is coming from. Beyond sales, there is a customer analysis page tracking customer numbers and churn rate, broken out by age group and balance band, so the revenue coming in and the customer base slipping away are visible at the same time.
- Analyse %YoY, %Target and Gap on every dimension
- Drill down to region, customer and product level
- Analyse the difference between plan and result
- Track customer numbers and churn rate by segment
What it does
- Daily sales forecasting with AI/ML
- Actual sales compared with forecast and target
- Month-to-date sales tracking
- Filter by product, category, region, channel and customer
- %YoY, %Target and Gap analysis
- Drill down to region, customer and product
- Track customer numbers and churn rate
- Connects to other systems in the organisation

Want something like this?
Tell us your situation and we will work out what needs adapting to fit it.