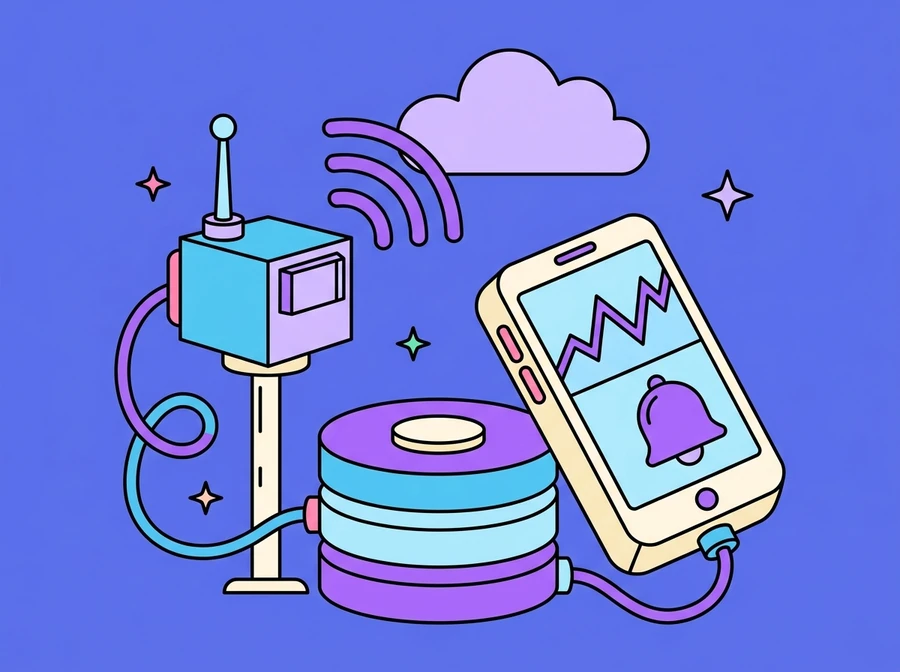
Work that connects field devices and sensors to something an organisation can actually act on: getting readings up to the cloud over a link that is not always there, storing them as time series that can be looked back over, setting thresholds so somebody hears about a problem before a customer reports it (through LINE and through SMS with Twilio), dashboards showing the current state of every point, and passing the same readings on to the forecasting work we already do, such as Predictive Maintenance, so the data earns its keep rather than only being recorded.
Who it is for
Organisations with equipment or measurement points spread across many locations, such as factories, buildings, cold rooms, warehouses or farms, where the team cannot walk round and check every point every day.
From the device on site to the cloud, and what that costs you
Sensors tend to sit exactly where the signal is worst: in plant rooms, under factory roofs, or out in a field a long way from the building. So we design on the assumption that the link will drop, not that it might. The device holds its readings locally when it cannot send, then sends them on with the time they were actually measured once it reconnects. On the receiving side, measurement time and arrival time are kept in separate fields, so a late batch lands in the right place on the chart instead of distorting it, and a repeated send is recognised rather than counted twice.
The other thing to settle on day one is device identity. Each device gets its own identity and its own key rather than a shared one across the fleet, because on the day a device is removed, handed to a different operator, or suspected of having leaked its key, you want to deal with that one device without touching every other device on the system.
- Readings sent over MQTT or HTTPS depending on what the device supports, or through a gateway when it cannot reach the internet itself
- Readings buffered on the device when the link drops, then sent on with their real measurement time
- Measurement time stored separately from arrival time, so late data lands in the right place
- Every device with its own identity and key, revocable one at a time
Storing readings so you can look back at them
What arrives is not a set of documents, it is a continuous stream where every point carries a time. So we store it all in one shape: device, metric, timestamp, value, and a status saying how far that value can be trusted, for example that it was backfilled after a dropout, or that it came from a sensor reading abnormally. Carrying that status from the start means nobody has to guess later whether an odd number was a real event or a failing sensor.
Recent data is kept at the full resolution the device sends. Longer history is kept as summaries per time bucket, so a chart covering several months does not have to read every row. Retention and deletion are agreed at design time, not when the disk fills up. The store itself can sit on GCP, Azure or AWS, or on PostgreSQL inside your own building when the data is not allowed to leave.
- One shape across the system: device, metric, timestamp, value and a trust status
- Ingestion that tolerates repeated sends without double counting
- Full resolution for recent data, time-bucketed summaries for long history
- Retention and deletion policy agreed at design time
- Stored on GCP, Azure, AWS or on PostgreSQL in your own environment
Alerting on thresholds, through LINE and SMS
Thresholds are set per metric and per individual device, because two cold rooms, or two pumps, do not necessarily deserve the same limits. The condition people forget is "no reading received", which has to count as an alert in its own right: a sensor that has gone quiet looks like a perfectly normal chart until somebody happens to notice.
Alerts go out over LINE for the site team, who have it open all day anyway, and over SMS through Twilio for the ones that have to reach a person even when they are not on the internet at that moment. What keeps an alerting system alive in the long run is not becoming noise: a value has to stay out of range for an agreed period before anything is sent, nothing repeats while the case is still open, and a message goes out again when the reading comes back into range. Every alert is logged with its acknowledgement, so you can go back and see what reached whom, when, and who picked it up.
- Thresholds per metric and per individual device
- "No reading received" treated as an alert condition of its own
- LINE for the site team, SMS through Twilio for the ones that must reach a person
- A reading must stay out of range for an agreed period before alerting, with no repeats while the case is open
- A follow-up message when the reading returns to range
- Alerts and acknowledgements logged for review
Dashboards over live readings, and the step into forecasting
The dashboard puts the latest reading from every point on one screen, with history over a chosen period, a list of devices that have gone quiet, and the alerts still open. The numbers on screen come from the same data the alerting engine reads, so the screen never says one thing while the LINE message says another.
What makes the data worth collecting is the step after that. A steady stream of readings is the raw material for the forecasting work we already do: accumulated running hours, temperature trends and vibration patterns become the variables a Predictive Maintenance model uses to judge which equipment should be serviced first. The same readings feed straight into the data pipelines and strategic dashboards you already run, without building a second, separate path for them.
- Latest reading per device, with history over a chosen period
- A list of quiet devices and the alerts still open
- Screen and alerts reading from the same data
- Readings passed on as variables for a Predictive Maintenance model
- Feeds the data pipelines and dashboards you already run
What it does
- Readings ingested over MQTT or HTTPS, through a gateway where needed
- Buffering on the device during dropouts, backfilled with real measurement times
- Per-device identity and keys, revocable one at a time
- Time-series storage: full resolution recently, summaries for long history
- Thresholds set per metric and per individual device
- Alerting when no reading arrives, not only when a value goes out of range
- Alerts over LINE and over SMS with Twilio, with acknowledgements logged
- Dashboard of latest readings, quiet devices and open alerts
- The same data feeding Predictive Maintenance models and data pipelines

Want something like this?
Tell us your situation and we will work out what needs adapting to fit it.