
We provide in-depth data analysis and design the dashboards and summary reports that support business strategy effectively. The problem we usually meet is not a lack of data, but data spread across so many systems that nobody can say where the business stands right now. Our job is to bring it all together into a single picture you can open and make a decision from within a few minutes.
The scope of our analytics work
We design both the overview for the leadership team and the detailed views for people on the front line, on the same set of data, so that no two departments end up holding different numbers.
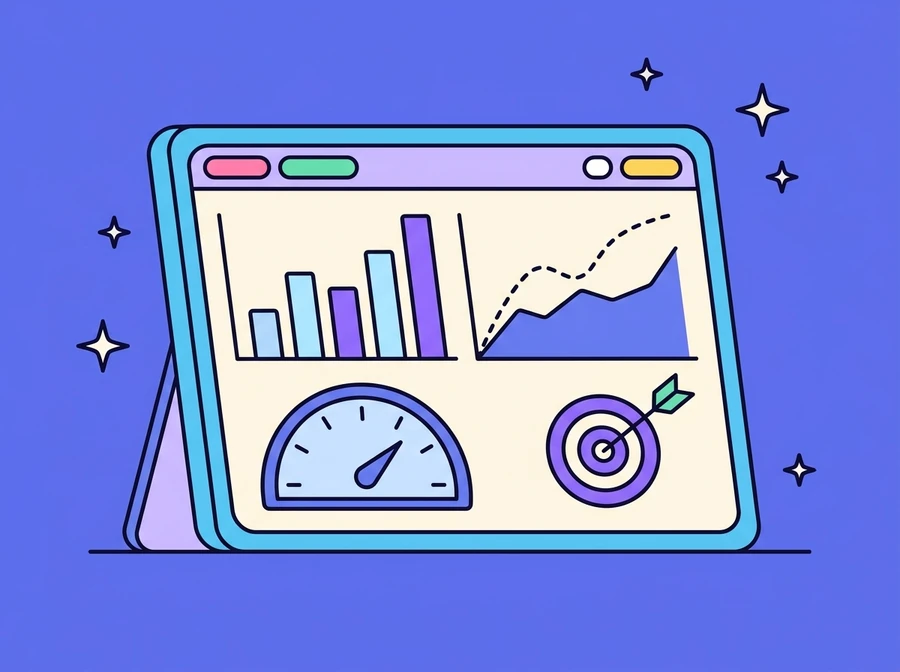
- Executive Dashboard, the overview for leadership: performance against target, settled on a single page.
- Sales & Marketing Analytics: daily and monthly sales against target, against last year and against forecast, drillable down to product, category, channel, area and customer, with basket analysis and the effect of discounts.
- Employee & Customer Insight Analytics: understanding customer behaviour and what staff are saying, through trend analysis, segmentation and sentiment taken from what people actually wrote.
- Data-Driven Strategic Planning: turning the analysis into strategic options, each with indicators you can genuinely track once the decision is made.
- Survey & Assessment: online surveys and assessments, with results summarised and answers explained question by question, used to gauge a team's knowledge or readiness before planning the next step.
Dashboards that answer back
Most dashboards stop at showing the numbers, but whoever opens one usually has an immediate follow-up question: why does it look like that? So we put a Data Assistant on the dashboard. You can ask it directly, in Thai, what happened, or send it the chart you are looking at and have it summarised. In the project portfolio management system, for instance, an AI Chat menu sits alongside the Overview, Monthly Trends and Anomalies pages, so executives get an answer without waiting for the next reporting cycle.
How we work with you
We do not start by opening a charting tool. We start from the questions that have to be answered, then work back to the data needed to answer them.
- 1. Agree the business questions first: be clear about who has to decide what, and how often.
- 2. Check the state of the data (sources, completeness, duplication and update cycles), before building reports on data that cannot yet be trusted.
- 3. Design and build the dashboard: put a prototype in front of real users first, then adjust it to how they are actually using it.
- 4. Hand over and pass on: train the users, set the data refresh cycle, and name who takes care of it from here.
What you get
What we deliver is more than a dashboard file: it also includes agreement on how the numbers are defined and how the whole thing is maintained (the part that keeps a report alive after the project ends).
- A dashboard that works in practice, with filters on the dimensions the business actually uses: product, category, channel, area and customer.
- A summary report for the leadership team that leaves the reader knowing what to do next.
- Metric definitions that every department understands the same way, so there is no arguing over whose figure is right.
- Documentation of the data structure and how to look after the system, so your own team can take it on.
Solutions in this area
AI Sales Dashboard
Forecast daily sales with AI and plan straight away, without waiting for the month-end close

AI Project Portfolio Management
See every project against its targets on one page, then ask follow-up questions in Thai

Survey & Assessment
Online tests and surveys with the result the moment you finish, plus an explanation for every question

Interested in this?
Talk to us and we will scope the work and the approach that suits your organisation.